Driving Biological Understanding of Data By Coupling Adverse Outcome Pathway Networks, R and Cytoscape

Driving Biological Understanding of Data By Coupling Adverse Outcome Pathway Networks, R and Cytoscape
AOPXplorer is available from the Cytoscape App Store. What are you waiting for? Download it and try it out

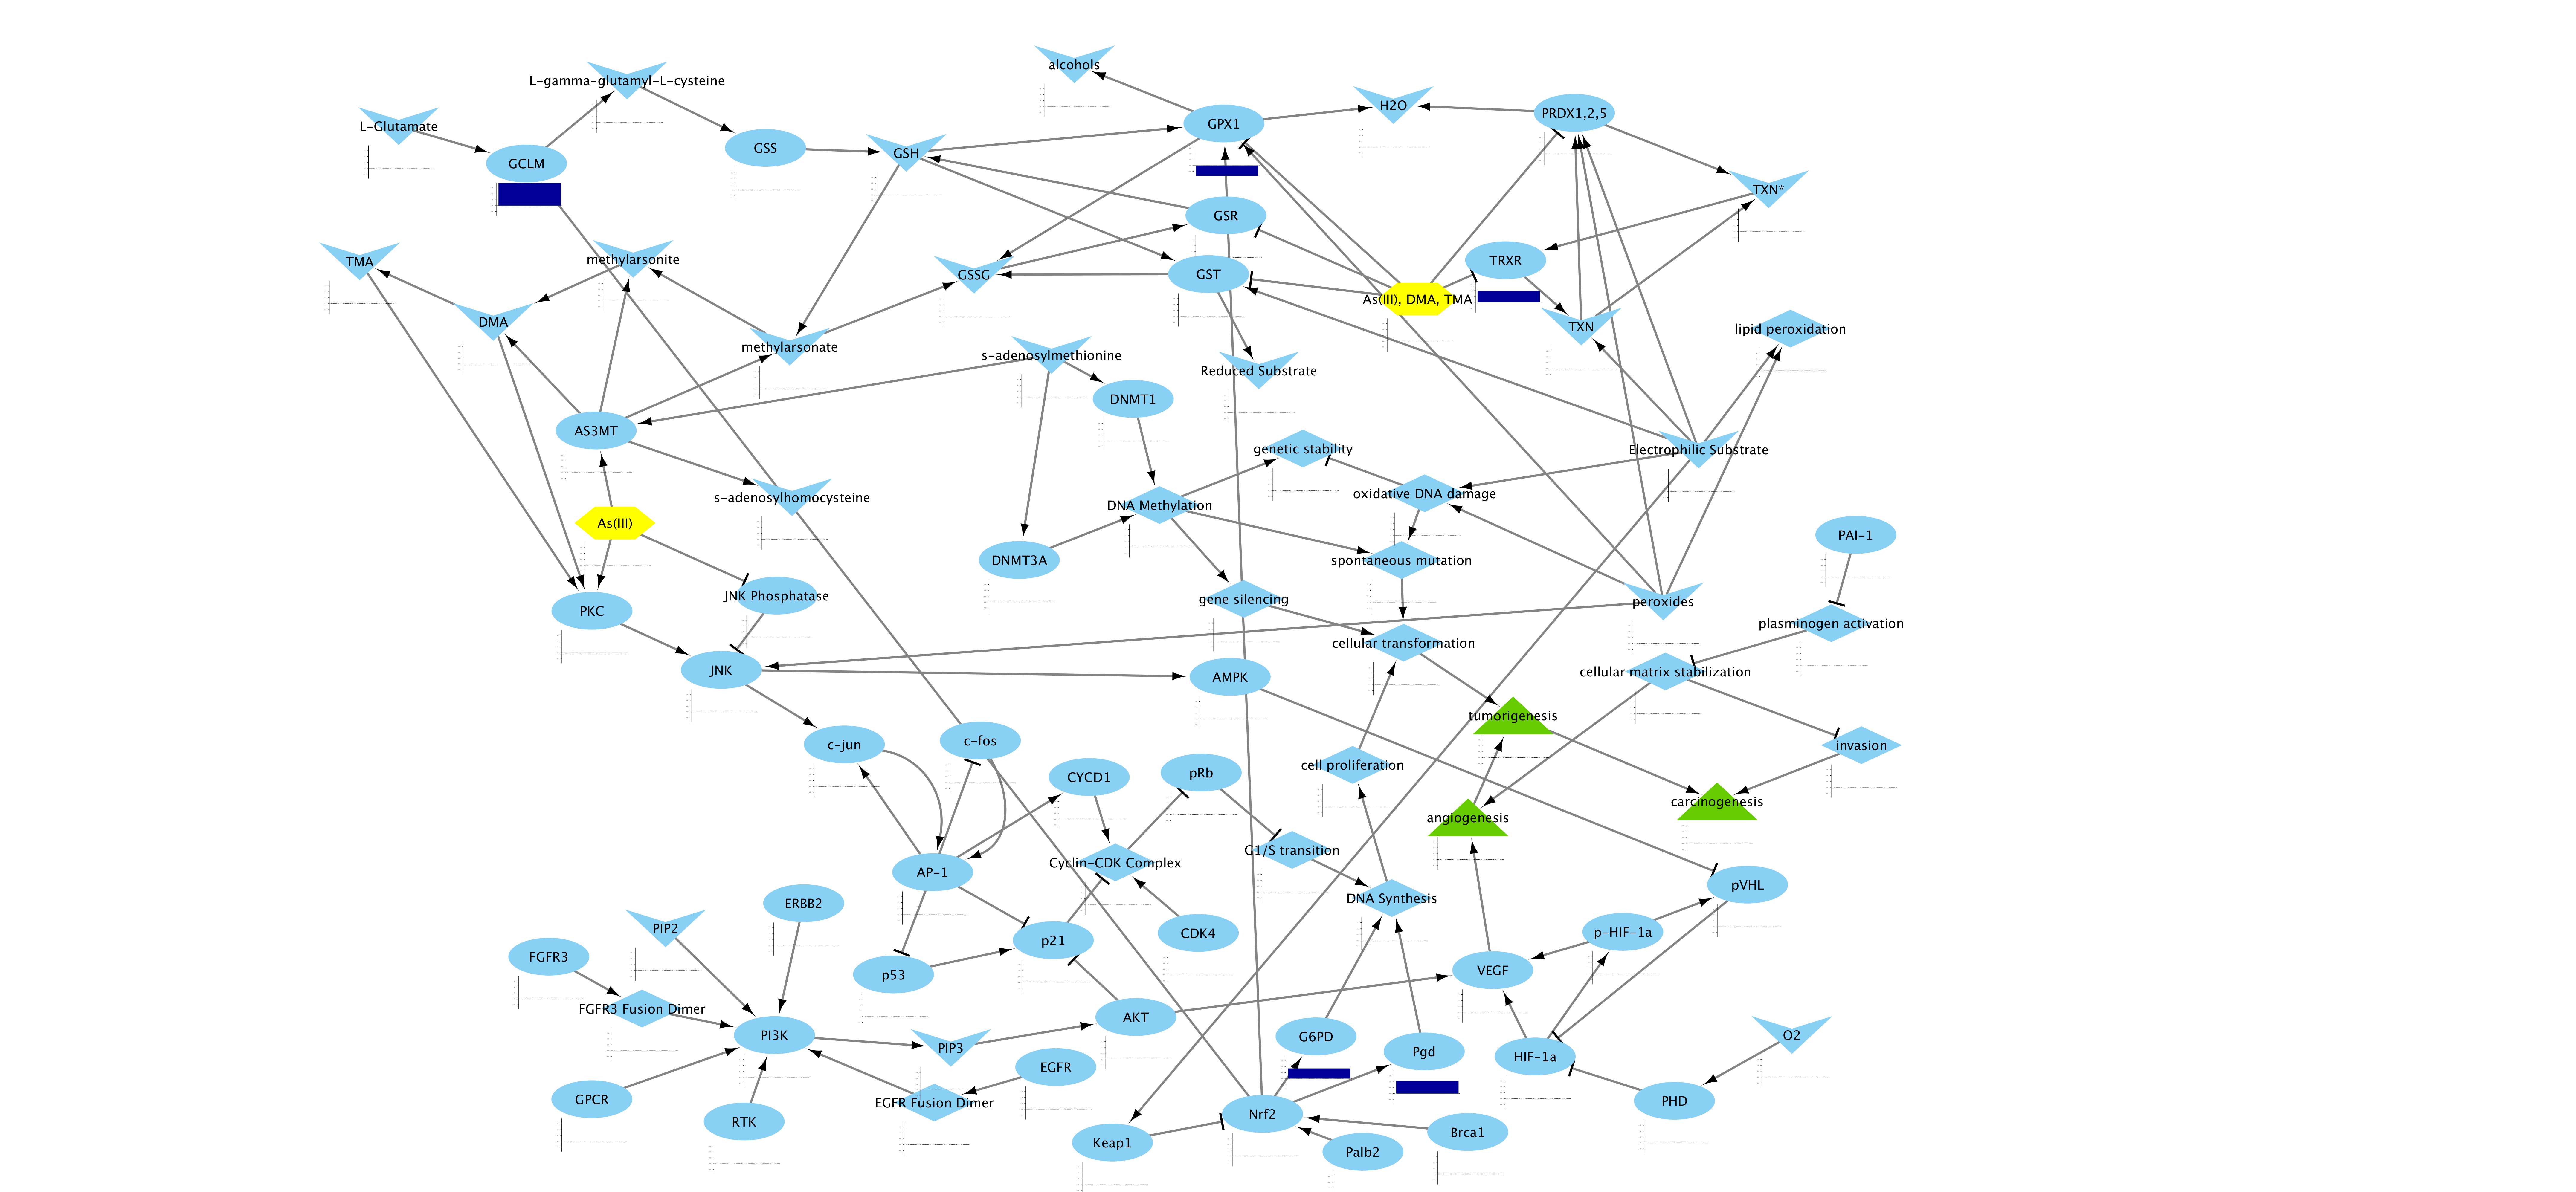
With AOPXplorer, you can visualize AOPs from the AOP Ontology. The AOP Ontology is a community resource updated with AOPs from the AOP-Wiki as well as disease pathways.

AOPXplorer uses the visualization power of Cytoscape. You can perform all of your data analyses using your favorite R workflows and packages. Import the data into Cytoscape and visualize your data on your favorite AOP Network.
Cytoscape and its apps -- these are all available to you when you use AOPXplorer. We know you don't want to learn a new user interface. We understand that it takes time to install software. That's why we minimized this as much as possible.
AOPXplorer's AOP Networks are built by a community of users and peer-reviewed. For more information contact Lyle Burgoon. A tutorial for building AOP Networks is coming soon. But here's the short version: Create a new network in Cytoscape, add key event nodes (proteins, genes, metabolites -- something measurable), add edges. Make sure you keep notes on what papers from the literature support each node-node interaction/edge. For inspiration, you can start from any of our pre-built AOP Networks.
Email Lyle Burgoon to get notifications about AOPXplorer's launch.