Driving Biological Understanding of Data By Coupling Adverse Outcome Pathway Networks, R and Cytoscape

Driving Biological Understanding of Data By Coupling Adverse Outcome Pathway Networks, R and Cytoscape

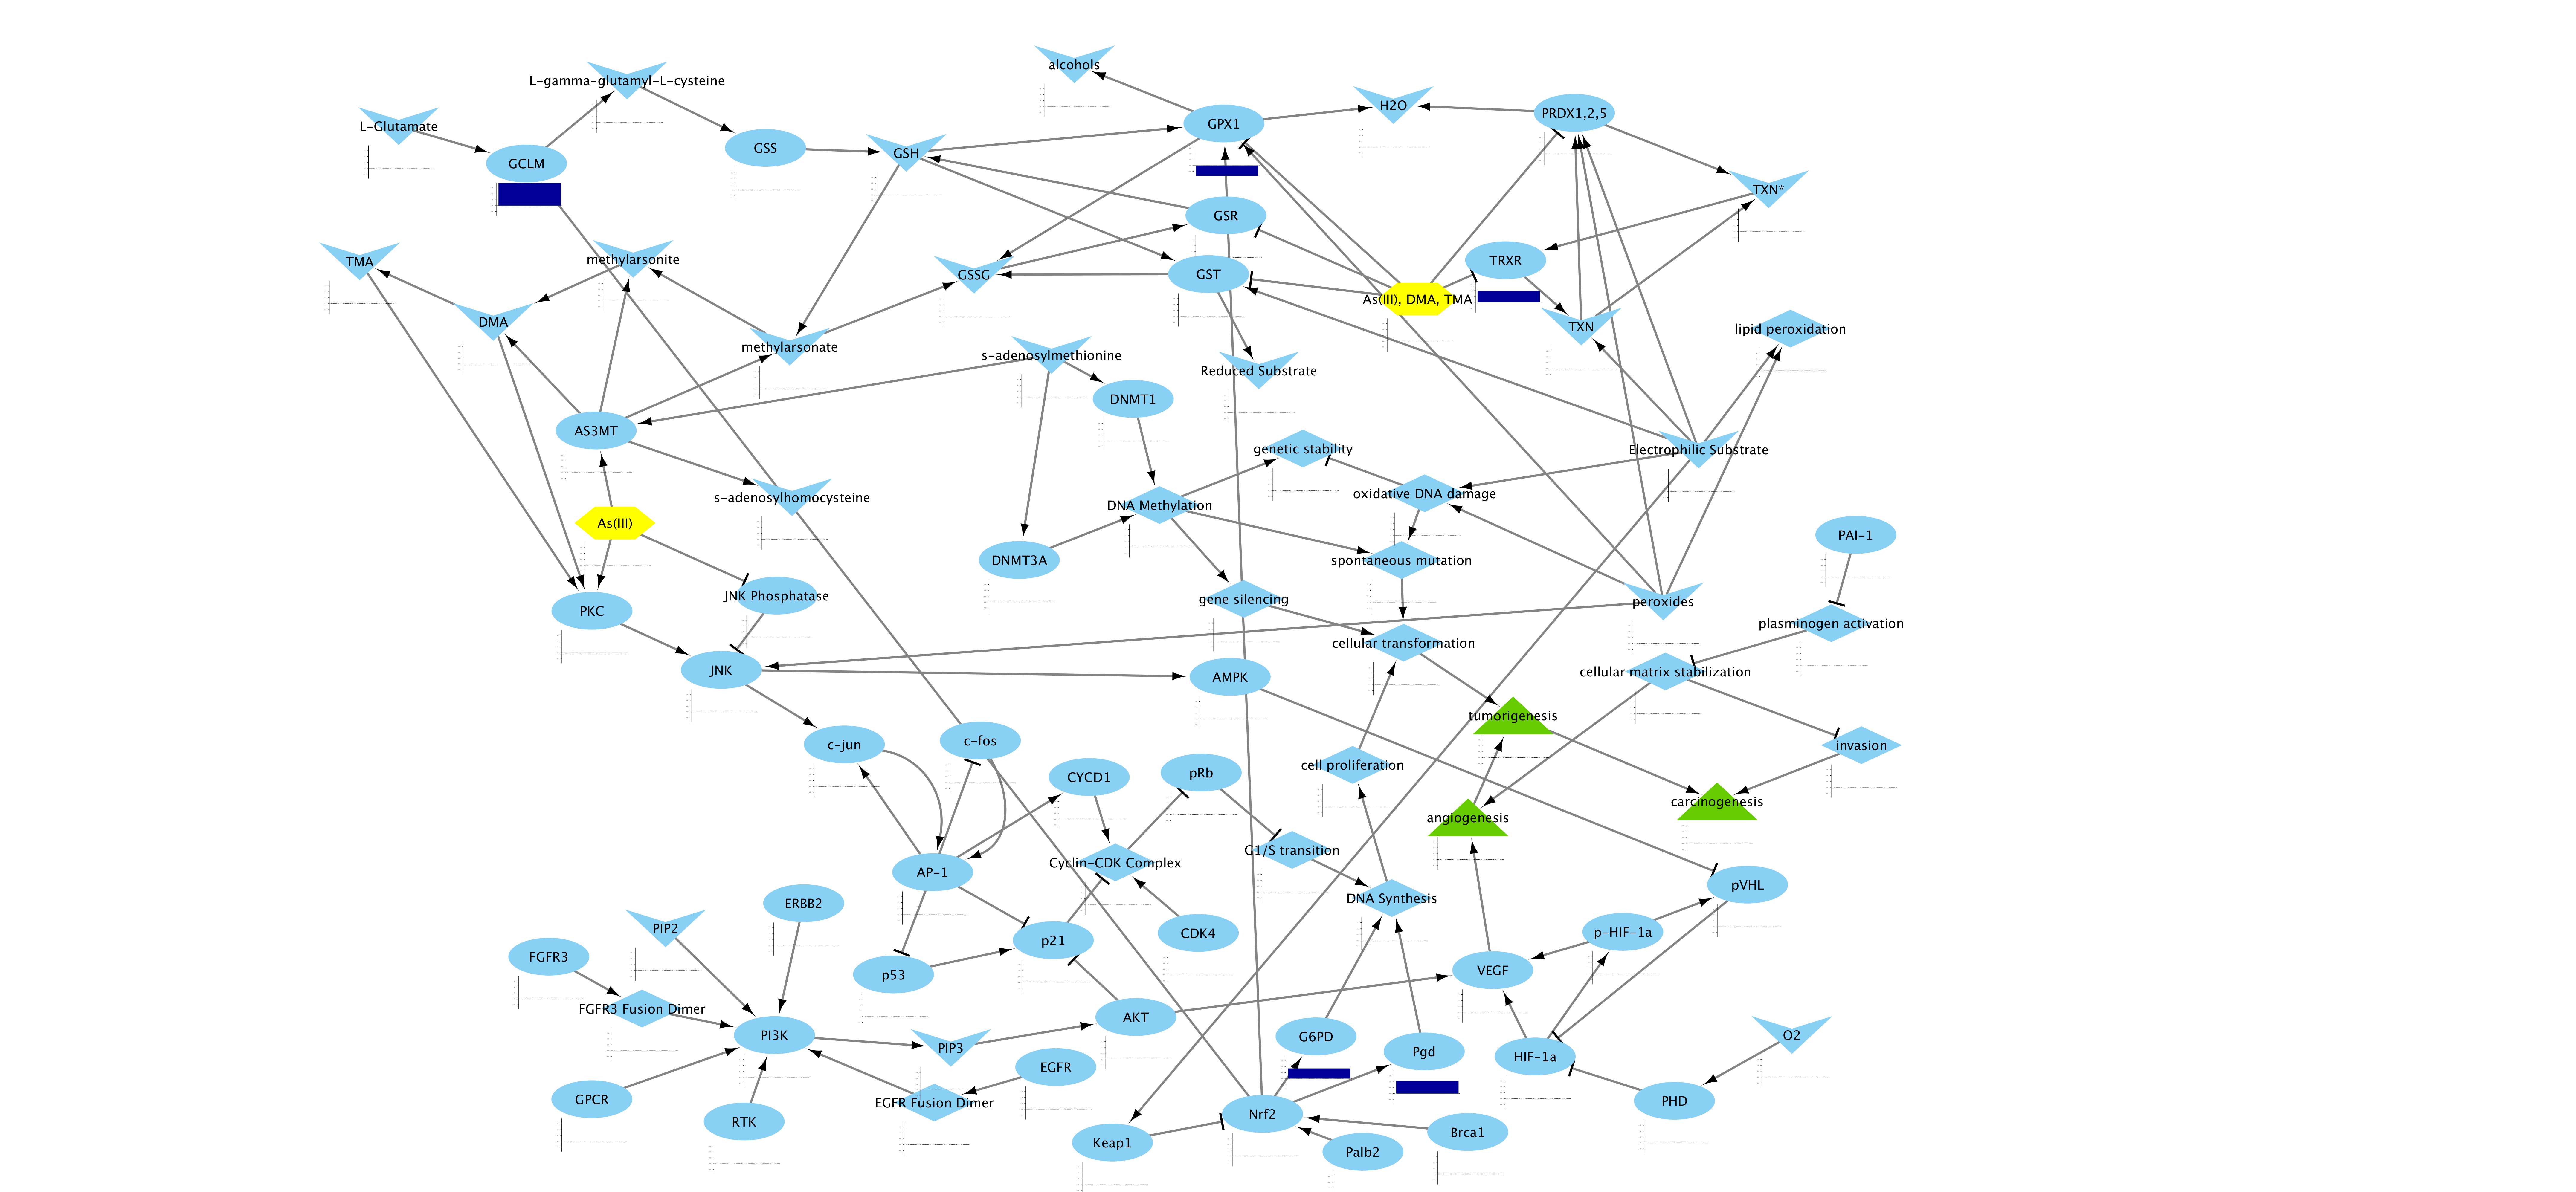
With AOPXplorer, you can visualize AOPs from the AOP Ontology. The AOP Ontology is a community resource updated with AOPs from the AOP-Wiki as well as disease pathways.

AOPXplorer combines the analysis power of R with the visualization power of Cytoscape. You can perform all of your data analyses using your favorite R workflows and packages. AOPXplorer allows you to send these analyses and AOPNs to Cytoscape for visualization.
R, RStudio, CRAN, Bioconductor, Cytoscape and its apps -- these are all available to you when you use AOPXplorer. We know you don't want to learn a new user interface. We understand that it takes time to install software. That's why we minimized this as much as possible.
The AOPXplorer will be ready for release soon. It is in the final streth of development, testing, and documentation. We expect a release around September 2016 (probably sooner).
Email Lyle Burgoon to get notifications about AOPXplorer's launch.